Perc Pineda, PhD
Chief Economist, PLASTICS
Tayce Shamamian
Research Assistant
In 2024, the U.S. plastics industry employed over a million people, according to PLASTICS’ 2025 Size and Impact Report[1]. When suppliers to the industry are included, total employment rises to more than 1.7 million. The downstream employment impact of plastics manufacturing extends even further. With over $550.1 billion in shipments, the industry generates a significant number of induced jobs—positions created in the broader economy as a secondary effect of income earned through direct and indirect employment.
By state, Texas, Ohio, Michigan, California, Pennsylvania, Illinois, Indiana, Wisconsin, North Carolina, and Georgia were the top ten states for plastics employment in 2024.
U.S. plastics industry’s undeniable presence in international markets
The U.S. plastics industry is ranked second in the Global Plastics Ranking® in terms of trade volume.[2] Its strong presence in international markets stems from export strength, generating a persistent trade surplus in plastic materials and resins. Preliminary data suggest that the U.S. plastics industry generated over $78 billion in total export value in 2025, maintaining its position as a major player in global plastics trade.
However, 2025 brought substantial changes to U.S. trade and tariff policy. As the Trump administration sought to balance U.S. trade relationships and strengthen domestic manufacturing—particularly in critical industries—exports continued, though at a lower rate relative to 2024. Imports also continued but were hampered by higher tariffs, especially on plastics-working machinery and plastic products.
Jobs supported by plastics industry exports
A key justification for the changes in the U.S. trade and tariff policy was the protection of American jobs, particularly in manufacturing. Higher exports are strongly associated with job growth and job creation, particularly in advanced economies like the U.S. The U.S. International Trade Administration uses industry-specific coefficients to approximate how many jobs are supported per $1 billion in export value. Applying the manufacturing industry multiplier allows us to approximate the number of jobs linked to plastics exports. Using this methodology, we estimate the state-level employment effects of plastics exports by the multiplier of 3,628 jobs per $1 billion in exports to the U.S. census estimates of plastics industry exports.
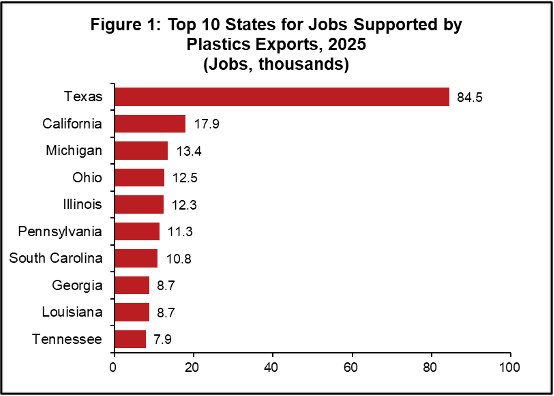
Overall, U.S. plastics industry’s exports supported over 284,000 jobs in 2025. The breakdown by states can be found in Figure 1. This represents a slight drop from the previous year, fueled largely by a $2 billion drop in exports from 2024.
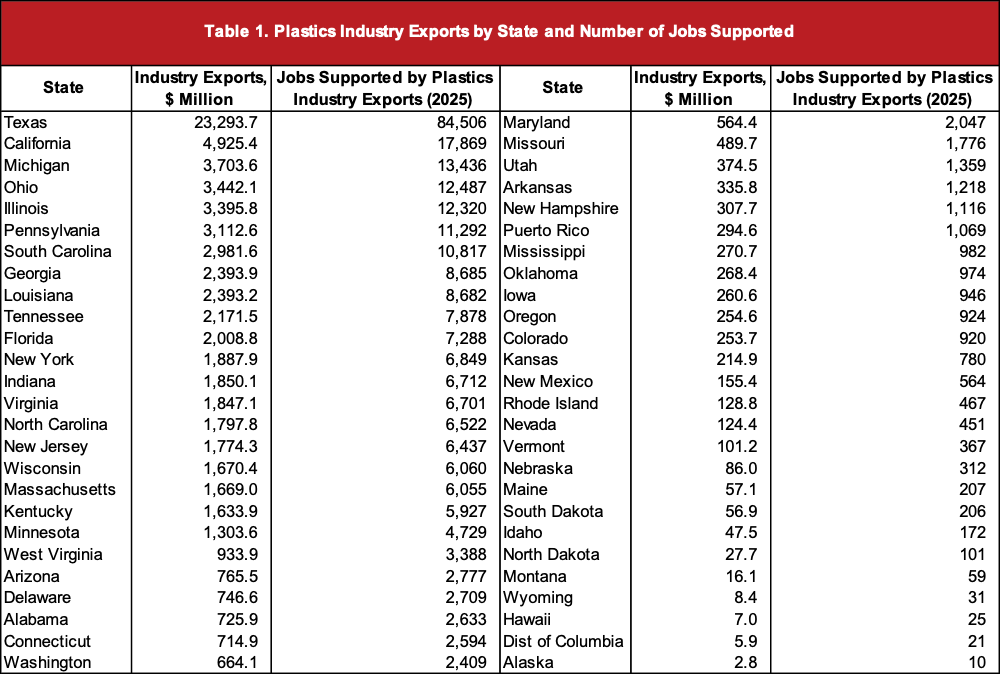
In addition to the over 1.7 million jobs, 284,000 jobs can be attributed to U.S. plastics exports in 2025. Figure 1 shows the breakdown of the top 10 states for jobs supported by plastics industry exports, while Table 1 shows the complete breakdown for the U.S. in terms of both industry exports and jobs supported. Texas stands out as an overwhelmingly large source of plastics exports, with over $23 billion in export value – a value that contributed to roughly 84,506 jobs – comprising 29.7% of all jobs supported by U.S. plastics exports. Moreover, nine of these states are the top ten states with highest employment in the plastics industry.
States play different roles in the plastics export supply chain
There is notable overlap between the top states for jobs supported by exports and plastics employment, though important differences remain. In Texas, its position as a major resin producer and exporter—combined with its role as a key shipping hub—clearly explains its top ranking. Mexico, the largest export market for the U.S. plastics industry, further reinforces Texas’s prominence, as geographic proximity facilitates strong cross-border trade flows. Similarly, while California is not typically associated with high plastics output, its strategic location, port infrastructure, and access to Mexican and Pacific markets make it a leading export state, supporting more export-related jobs than states such as Michigan or Ohio.
These distinctions highlight each state’s unique role in the plastics supply chain and explain why a state with lower overall plastics employment, such as Louisiana, can support more export-related jobs than Indiana.
Taken together, these data illustrate the breadth and depth of the U.S. plastics industry’s impact—both domestically and internationally. The industry not only provides over 1.7 million direct and supplier-supported jobs but also drives hundreds of thousands of additional positions through exports and related economic activity. States contribute in different ways, whether through production, strategic logistics, or access to key export markets such as Mexico. Understanding these dynamics underscores the importance of supporting the plastics supply chain, trade policies that enable competitiveness, and investments that strengthen U.S. manufacturing for sustained employment and economic growth.
[1]See 2025 Size and Impact Report. www.plasticsindustry.org
[2]See 2025 Global Trends Report. www.plasticsindustry.org