Perc Pineda, PhD
Chief Economist, Plastics Industry Association
Overview of private construction spending
Building and construction—one of the key end markets for the plastics industry—was estimated at a seasonally adjusted annual rate of $2.19 trillion in January 2026, based on U.S. Census Bureau data on the value of construction put in place. Plastics are integral to this market, with applications spanning pipes and fittings, films and house wrap, insulation, wire and cable, window profiles, roofing membranes, sealants, and wall and floor coverings, among many others.
While construction spending is not a leading indicator for plastics, demand is closely tied to the installation phase, with different products entering at various stages of a project. Housing starts and permits, along with nonresidential starts, serve as leading indicators for plastics manufacturing, whereas construction spending provides insight as a lagging-to-coincident indicator.
Early 2026 Trends
Against this backdrop, early 2026 data show a mixed start to the year in construction spending. It started on a softer note, edging down 0.3% month over month. On a year-over-year basis, spending rose 1.0%—a modest gain but still moving in the right direction. Of total construction spending, 75.8% ($1.66 trillion) is private construction, and the balance (24.2%) is public construction.
Within private construction, 56.2% is residential and 43.8% is nonresidential. The breakdown of private nonresidential construction reveals that manufacturing, power, commercial, and office construction hold higher shares of spending as shown in the chart below.
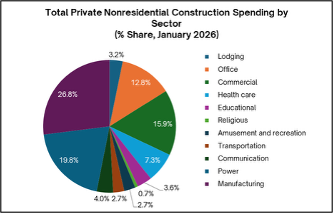
Monthly and year-over-year changes in these sectors were mixed. Manufacturing, which accounts for 26.8% of nonresidential construction, fell 2.0% from December and was down 15.0% compared with January last year. Power facility construction was unchanged from December but increased 3.4% year over year. Commercial construction decreased 0.1% month over month and 0.7% year over year. Office construction, by contrast, increased 1.1% from December and rose 4.8% from January last year.
Insights for plastics manufacturing
Shifts in construction spending provide key insights for the plastics industry. Manufacturing is the primary customer of plastics, and the 18.4% decline in manufacturing construction from its peak in August 2024 to January 2026 suggests that expansionary momentum has moderated. Over the same period, the Industrial Production Index for manufacturing rose by only one point, resulting in average capacity utilization of 75% amid steadily increasing U.S. industrial capacity. Longer-term data show that the ramp-up of U.S. manufacturing capacity continued after the COVID-19 pandemic, reaching 30.2% of industrial capacity in January 2026 relative to 2017.
In U.S. Census construction spending estimates, office construction includes data centers, which rely heavily on plastics—for cabling and connectivity, cooling and airflow management, enclosures and server components, construction and safety systems, and more. Monthly and annual increases in this category reflect rising computing demand, expansion of cloud and digital services, and the growing application of artificial intelligence (AI), which in turn drives the need for infrastructure and utility upgrades.
Overall, early 2026 shows a mixed but cautiously positive picture for private construction. While traditional manufacturing and commercial construction have softened, growth in office and data center construction highlights emerging opportunities for plastics demand—particularly in high-tech applications, cabling, cooling, and safety systems. Monitoring these spending trends alongside industrial production and capacity utilization provides plastics manufacturers with a clearer view of market timing, product application opportunities, and potential areas for growth in an evolving construction landscape.