Perc Pineda, PhD
Chief Economist
Tayce Shamamian
Research Assistant
Of particular importance, as discussed in PLASTICS’ 2025 Global Trends Report, is that several countries dominate in U.S. plastics trade, especially in terms of imports and trade deficits.[1] For instance, in plastics machinery, the U.S. had the largest trade deficit with Germany, Austria, Italy, Japan, and Canada, underscoring the significant share of imports of equipment used in the U.S., alongside domestic equipment manufacturing. Looking at the effect of higher tariffs on U.S. imports provides important clues going forward, enabling the U.S. plastics industry to manage its global supply chain.
Trade Numbers in Flux
Looking at trade data, year-to-date (YTD) ending August 2025, the latest available data, U.S. plastics industry imports shifted when compared to YTD August 2024. Imports of resin have reached $13.3 billion so far this year, 6.9% lower than the same period last year. Imports of plastic products reached $33.2 billion in 2025, down 12.8% from 2024. By contrast, imports or plastics machinery and molds increased this year, reaching $2.7 billion – a 5.3% increase from 2024 – and $1.5 billion – a 7.1% increase from 2024 – respectively.
Plastics Trade with Key Partners
The top 10 U.S. plastics imports by country origin comprised 81.2% of U.S. plastics imports across the four main categories: plastics materials and resin, plastics products, plastics machinery, and plastics molds. The table below compares YTD trade data between 2024 and 2025.
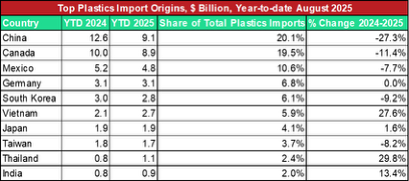
The changes in U.S. imports of plastics from the top 10 countries of origin have been mixed. One would expect that imports decreased because of higher tariffs, which has been the case with some countries, but it has also increased in others.
Uneven Reciprocal Tariffs and Negotiated Outcomes
One explanation for this divergence is that higher tariffs were not applied uniformly across all commodities in Chapter 39 of the U.S. Harmonized Tariff Schedule (HTS), which covers plastic materials, resins, and products, or in Chapter 84, which covers plastics molds and machinery. Tariff rates also vary by country of origin. Beyond the reciprocal tariffs imposed by the Trump Administration in April 2025—dubbed “Liberation Day”—other tariffs apply under Section 301 for unfair trade practices and Section 232 for national security, including 50% tariffs on steel, aluminum, and derivative products, as well as higher auto tariffs.
While trade policy uncertainty runs high, the reciprocal tariffs announced in April 2025 have been modified multiple times throughout the year as a result of trade negotiations between the U.S. and some of its trading partners. Notably, as far as the top 10 countries of origin for U.S. imports of plastics as identified in the table above, there have been changes between the proposed reciprocal tariffs and rates resulting from trade negotiations.
China
During the initial wave of reciprocal tariff announcements, China faced the one of the highest threatened tariff rates (34%), and the Trump administration has suggested several additional tariff measures – including rare earth export controls, Russian and Venezuelan oil, maritime and cargo handling equipment – while already being subject to Section 301 tariffs. The implementation of the reciprocal tariffs has been delayed several times, and goods from China are currently subject to the baseline 10% reciprocal tariff.
The newly announced trade agreement primarily removes or reduces the tariffs levied against China, such as lowering the fentanyl tariff rate, and suspending/allowing other import controls to expire. China is adopting similar measures, such as removing its retaliatory measures and resuming exports of rare earths. It remains to be seen if further actions to improve the U.S.-China trade relationship will take place with the agreement in place.
Canada and Mexico
Canada and Mexico were exempted from the initial reciprocal tariffs but have faced pressure from the administration in the form of other tariffs, such as a 10% fentanyl tariff that pressures energy, energy resources, and potash, as well as 35% and 25% for other products from Canada and Mexico respectively. Additionally, a transshipment penalty was implemented over the summer, which applies a 40% tariff on exports from other countries that are shipped into the U.S. through Canada. Notably, the fentanyl tariff is currently 0% for goods entered under the United States-Mexico-Canada Agreement (USMCA).
USMCA remains the primary trade agreement through which the U.S. deals with Canada and Mexico. Major developments in this respect will revolve around the renegotiation of the agreement next year, and the direction negotiations take will largely be dictated by the organization and their feedback from industry consultations.
Germany
Germany has faced direct pressure from the U.S. over tariffs and trade as a key player in the European Union. Its trade relationship with the U.S. will be defined by the trade negotiations, referred to as the U.S.-EU Tariffs and Trade Framework Agreement in August. The Trump administration has threatened various high tariffs against the EU, particularly on alcohol products and digital services, but with the trade deal in place, trade between the U.S. and EU has not been severely disrupted – albeit slightly lower, year to date ending August 2025. In terms of tariffs, the trade deal allows the U.S. to apply higher of the preexisting Most Favored Nation (MFN) rate (Column 1 General in the U.S. HTS) or 15% on most EU imports,
South Korea and Japan
South Korea was in line for a 25% reciprocal tariff, but with the negotiation of a trade deal, its current tariff rate is similar to the EU, with imports being subject to the higher of the U.S.-Korea Free Trade Agreement or MFN tariff rate, or the reciprocal tariff rate of 15%. Similarly, Japan was listed for a 24% rate and is subject to the same 15% reciprocal or MFN rate conditions as Korea and the EU. Japan is subject to aerospace exemptions and certain products that cannot be produced domestically at scale to meet U.S. demand. Each country has signed a Technology Prosperity Deal with the United States, and Japan has committed to further investment.
Vietnam
Under the initial reciprocal tariff rates, Vietnam would have been subject to 46% reciprocal tariffs on exports to the United States. The new trade deal between the two countries resulted in a 20% reciprocal tariff rate on imports from Vietnam, along with the review and eventual reduction of non-tariff barriers on industrial and agricultural goods to improve market access. Vietnam will reduce almost all tariffs on U.S. exports while the U.S. works to identify items to receive a 0% tariff rate for imports from Vietnam. As one of the major emerging markets for the plastics industry, this agreement represents a significant improvement in the U.S. trade relationship with Vietnam.
Taiwan
The initial reciprocal tariff rate on imports from Taiwan was slated to be 36%, though the current rate has been substantially reduced to 20%. This rate does not apply to Taiwan’s semiconductor exports. Taiwan is seeking to lower this rate further to 15%, but an exact timeframe or progress on negotiations has not been established.
Thailand
The Liberation Day reciprocal tariffs initially pushed a 36% rate on imports from Thailand, though its trade deal with the U.S. has reduced this rate down to 19%. Like Vietnam, a list of commodities subject to 0% will be identified for imports from Thailand while Thailand will eliminate tariffs on 99% of goods and reduce non-tariff barriers across various sectors, particularly food and automotive.
India
The U.S. has implemented a 25% reciprocal tariff on India, a 25% tariff on certain products as part of a Russian oil tariff and threatened a 25% Venezuelan oil tariff. The negotiation of a trade deal is currently ongoing at the time of writing.
Taken together, the trade developments of 2025 underscore a central reality for the U.S. plastics industry: tariff impacts are uneven, highly product-specific, and deeply influenced by evolving bilateral negotiations. While higher tariffs have constrained imports from some key partners, others have seen stable or even rising trade flows as rates were revised or exemptions applied. For an industry that relies on globally integrated supply chains, understanding where tariff pressures are binding remains essential. As negotiations continue and policies continue to evolve, firms will continue to be challenged to maintain competitiveness in an uncertain global trade environment. Still, businesses can find comfort in the fact that cost-prohibitive import rates cannot sustain economic growth—hence, the resolution of tariff issues may ultimately emerge.
[1] See Plastics Industry Association, Global Trends 2025 (2025), https://www.plasticsindustry.org/data-report/global-trends-2025/

As government representatives gather in Paris, France, this week under the auspices of the United…
