Perc Pineda, PhD
Chief Economist, PLASTICS
The main customers of the U.S. plastics industry are manufacturers across various sectors. However, a higher percentage of total plastics demand—based on PLASTICS’ monthly demand estimates, which averaged $22.7 billion in 2025—ultimately flows into final personal consumption.[1]
In 2024, 75.4% of plastic products ended up in personal consumption, including everyday items such as toys, eating utensils, detergent bottles, motor vehicles, refrigerators, and other household goods.[2] Last year (2025) closed with plastics demand estimated at $22.7 billion in December, up 1.1% month-over-month but down 1.0% year-over-year.
Why the Retail-Plastics Link Matters for the Supply Chain
For businesses throughout the plastics industry supply chain, understanding the relationship between retail sales and plastics shipments is crucial. Data confirms the strong intuition: there is a high correlation between retail sales (and retail + food services sales) and shipments of plastics and rubber products. As shown in the figure below, from January 2016 to December 2025, the correlation in levels reached 0.96.
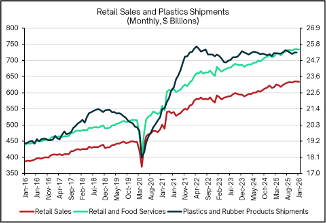
Since retail sales are widely regarded as a leading indicator of economic activity, shifts in their trajectory can signal upcoming changes in manufacturing and business activity. In January 2026, retail sales and retail + food services sales experienced a modest 0.2% month-over-month downtick—not an ideal start to the year. On a year-over-year basis, however, retail sales rose 3.0%, while retail + food services sales increased 3.2%.
By contrast, the month-over-month changes in plastics and rubber products shipments show a lower correlation with retail sales (0.57) and retail + food services sales (0.60) over the same period. Year-over-year correlations are noticeably higher, at 0.71 and 0.74, respectively.
Testing for Causality: Retail Sales Lead Shipments
The old saying goes, “Correlation does not imply causation.” One statistical method to test for predictive precedence (i.e., possible leading relationships) is Granger causality, which examines whether one variable consistently helps forecast another beyond the latter’s own past values.
Analyzing monthly U.S. data from January 2016 through December 2025, and testing look-back periods from 4 months to 12 months, the results were consistent: retail sales appear to Granger-cause plastics and rubber products shipments. In other words, past changes in retail sales helped predict future shipments, but past shipments did not help predict future retail sales. This suggests a unidirectional leading relationship from consumer demand to plastics manufacturing output.
The Moderating Role of Retail Inventories
Changes in retail sales influence plastics and rubber shipments, but the effect is moderated by retailers’ inventory levels. The retail inventory-to-sales (I/S) ratio is a classic indicator of stock overhang or tightness.
When the I/S ratio rises—meaning retailers hold more inventory relative to current sales (perhaps due to weaker demand, over-ordering, or supply-chain front-loading)—it tends to slow or flatten downstream shipments of plastics and rubber products in subsequent months. Manufacturers receive softer orders as retailers work down excess stock rather than reorder aggressively.
A longer time series (January 1992 to December 2025) shows that the U.S. retail I/S ratio trended downward from the 1990s (typically 1.4–1.7) toward greater efficiency, reaching 1.1–1.3 in recent decades thanks to improved supply-chain management, just-in-time practices, and data analytics.
Recently, the ratio has stabilized around 1.10–1.14 in 2023–2025—slightly above the post-2021 low but still lean by historical standards. A sustained rise in the I/S ratio (e.g., +0.05 or more over several months, indicating inventories growing faster than sales) has historically preceded flat or declining plastics shipments growth 3–9 months later. Conversely, a declining or stably low I/S ratio supports steady or accelerating shipments.
Although noisy monthly data makes precise quantification difficult, the pattern from 1992–2025 suggests that when retail sales growth slows while inventories continue rising, plastics shipment growth tends to decelerate by roughly 0.5–2.0% per month. In the 2023–2025 period, with the I/S ratio hovering at 1.10–1.14 and no major buildup, plastics shipments remained stable—showing no significant drag from inventory overhang.
Key TakeawayThe strongest driver remains retail sales growth, which pulls plastics shipments along. Rising retail inventory relative to sales acts as a moderating or delaying factor, often slowing shipments until the overhang clears. In recent years (2023–2025), balanced inventories relative to sales help explain the steady (non-explosive) pace of plastics shipments despite solid retail growth.
[1] See Plastics Demand Estimate. https://www.plasticsindustry.org/resource/plastics-demand-estimate/
[2] See 2024 Size and Impact. https://www.plasticsindustry.org/data-report/size-and-impact-2024/

According to the statistics compiled and reported by the Plastics Industry Association’s (PLASTICS) Committee on…

Shipments of primary plastics machinery (injection molding and extrusion) in North America increased in the…
