Perc Pineda, PhD
Chief Economist
In 2025, the U.S. plastics industry navigated a year of pronounced cyclical volatility, shaped by shifts in production, shipments, employment, trade, and prices, all against the backdrop of higher tariffs. Plastics production and employment experienced uneven fluctuations, reflecting supply-side constraints and demand–supply adjustments, while shipments continued to expand modestly, supported by underlying macroeconomic growth. Trade in molds and machinery showed mixed signals, with export values buoyed by higher tariffs and import patterns reflecting both price and quantity adjustments across equipment types. At the same time, plastics material and resin prices eased as inventories remained elevated, and capacity utilization diverged between conversion and resin manufacturing. Collectively, these trends illustrate an industry responding to tariff pressures, cyclical demand shifts, and cost dynamics, highlighting both resilience and vulnerability in 2025.
1. Plastic Products Manufacturing
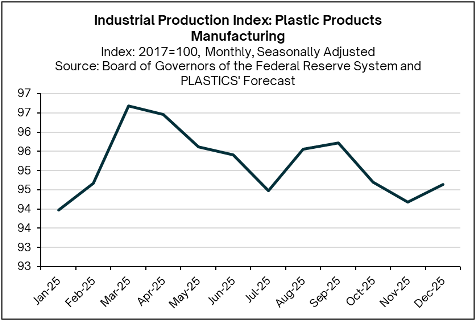
Plastics production in 2025 displayed pronounced cyclical volatility, reflecting the interplay between demand–supply dynamics and tariff-driven uncertainty. A 2.1% production increase in March was short-lived, as rising tariff-related concerns across the broader manufacturing sector drove the cycle into contraction through July. Partial rebounds proved unsustained, coinciding with an estimated 3.7% decline in work-in-process inventories in H1 2025 and a further 2.7% drop by the end of Q3, signaling weaker demand conditions in plastics industry end markets. These dynamics unfolded against the backdrop of uneven tariff impacts across the supply chain, as well as sector-specific factors. Production fell 1.1% in October and 0.5% in November, with a modest 0.5% increase likely in December, highlighting the cyclical sensitivity of the industry to both macroeconomic conditions and sector-specific demand patterns.
2. Plastics and Rubber Shipments
Shipments of plastics and rubber products in 2025 started at $25.0 billion in January and rose by 1.1% through September. The divergence between rising shipments and declining production suggests that a significant share of shipments was met by inventories, which fell 1.9% year over year in September. The increase in shipments aligned with stronger macroeconomic conditions, as U.S. GDP expanded by 3.8% in Q2 and 4.3% in Q3, supported by personal consumption expenditure growth of 2.5% and 3.5%, respectively. In the final quarter of 2025, shipments are expected to have increased at a modest monthly average pace of 0.2%.

3. Plastics Manufacturing Employment
Relative to the broader manufacturing sector, the unemployment rate in plastics and rubber products manufacturing exhibited more pronounced volatility. The rate stood at 8.2% in January before falling sharply to 2.9% in February, then easing and flattening to 2.4% in both August and September, with fluctuations in the intervening months. Overall, employment dynamics in plastics manufacturing showed a downside bias driven more by supply-side constraints than by demand conditions.
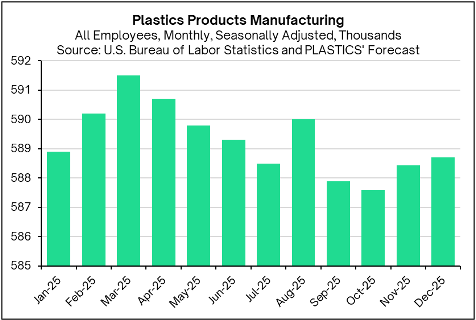
Based on monthly data, total employment in plastics product manufacturing is estimated to have peaked at 591,500 in March 2025 before declining over the subsequent four months, consistent with the contraction in plastics production. Following a brief increase in August, employment pulled back again in the remaining months of the year. In October, employment was estimated at 587,600 and likely rose modestly to above 588,000 in November and December.
4. Molds for Plastics Trade
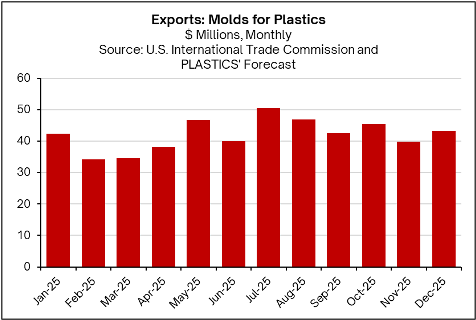
Based on monthly averages, U.S. mold exports, measured on a free-alongside-ship (FAS) basis in U.S. dollars, averaged $42.0 million in 2025—slightly higher than the $41.6 million monthly average in 2024. This increase in export value occurred even as higher tariffs raised production costs and heightened concerns about potential trade retaliation. Rather than reflecting stronger foreign demand, the higher export values largely stemmed from price increases driven by rising material and input costs in moldmaking. In contrast, export volumes declined sharply, with U.S. mold exports down 33.7% year-to-date through September compared with last year, indicating that higher prices offset weaker volumes. On a monthly basis, the U.S. Census Bureau reported exports of $42.6 million in September, while projections for October through December indicate a 6.5% rise in October, a 12.4% decline in November, and a 9.0% rebound in December.
5. Producer Prices in Plastics Material and Resin Manufacturing
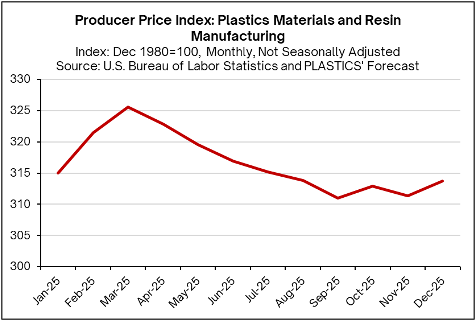
Plastics material and resin prices peaked in March of 2025 before gradually declining as demand and supply rebalanced. Inventory levels in plastic and rubber products manufacturing remained elevated at $15.0 billion monthly, indicating that ample supply at processors is not stimulating additional demand, which contributes to downward price pressures. Lower energy prices have also helped keep manufacturing costs in check. It is expected that the United States maintained a trade surplus in resin in 2025; by and large, imports of resin at higher reciprocal tariffs did not generate significant and broad-based upward price pressures in materials and resin manufacturing.
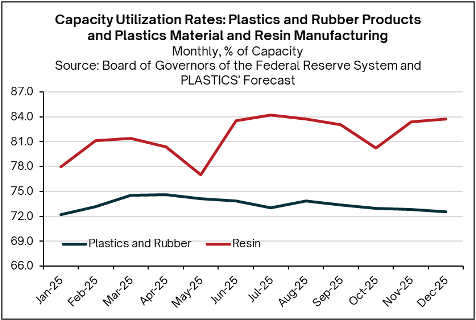
6. Capacity Utilization Rates in Plastics and Resin Manufacturing
The capacity utilization rate in plastics product manufacturing declined throughout 2025, averaging 75.0% monthly in 2024 and falling to an average of 73.4% for the year, with December projected at 72.5%. This decline reflects the observed slowdown in plastics conversion activity over the year. Meanwhile, capacity utilization in plastics material and resin manufacturing averaged 81.7% in 2025—down from 83.5% last year—but has shown an upward trend during the year. December may have seen a slight increase of 0.4%. The combination of higher utilization in resin production and weaker demand is consistent with the decline in resin prices.
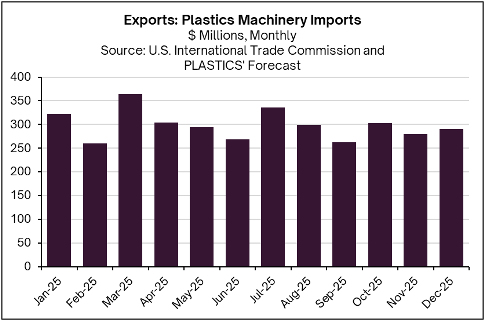
7. Plastics Machinery Imports
Through September 2025, total imports of plastics machinery and equipment rose 5.3% to $2.7 billion. While higher tariffs contributed to price-driven increases, their effects varied across machinery types. Injection-molding machine imports fell 2.4% to $539.8 million; extruders dropped 31.6% to $126.5 million, and blow-molding machinery surged 25.5% to $173.2 million. In quantity terms, injection-molding machines increased 7.1% to 4,976 units; extruders declined 16.1%, and blow-molding machines jumped 164.7% to 1,228 units, reflecting sharp cyclical adjustments in response to supply, demand, and tariff pressures. Projected fourth-quarter import values—$302.8 million in October, $279.1 million in November, and $290.2 million in December—suggest that total imports likely rose about 3.8% in 2025 underscoring, continued volatility shaped by tariff pressures and plastics machinery-specific dynamics.
Looking ahead to 2026, the plastics industry should keep three key considerations in mind. First, the economy will operate in an environment of lower interest rates, with the Fed funds target now at 3.50%–3.75% with the additional rate cuts – depending on how employment and inflation data evolve. Higher rates above 4.0% since 2023, which peaked at 5.50%, contributed to an interest-rate–driven manufacturing slowdown, directly and indirectly affecting plastics production through weaker end markets. However, it should be noted that changes in monetary policy operate with lags. The effects of a lower benchmark interest rate may take time to materialize, depending on the speed at which lending rates adjust across the financial system. Second, tariffs will continue to exert uneven effects on the industry, even as U.S. trade agreements have lowered some reciprocal tariff rates. Finally, as a mature industry, the growth of plastics manufacturing will generally track overall U.S. economic growth. With the U.S. economy having expanded above trend for 18 consecutive quarters, 2026 is likely to see growth continue, albeit at a slightly slower pace—providing a cautiously optimistic backdrop for the industry.

Assessing the plastics industry landscape in 2023 reveals a year marked with nuanced shifts across…