An estimated 651,800 Americans work in plastic bottles, laminated plastics plate, and sheet manufacturing, according to the Bureau of Labor Statistics. A plastic bottle ban would put all those jobs in jeopardy. Producing more glass and aluminum would also raise greenhouse gasses and global warming.
Perc Pineda, Ph.D.
Chief Economist
Climate change concerns deserve our full attention and objective policy responses. So, it’s important to compare alternatives when considering banning plastics to reduce greenhouse gasses.
If plastics bottles, for instance were banned, would the alternatives such as glass or aluminum be better for the environment? What about the economy?
An estimated 651,800 Americans work in plastic bottles, laminated plastics plate, and sheet manufacturing, according to the Bureau of Labor Statistics. A plastic bottle ban would put all those jobs in jeopardy. Producing more glass and aluminum would also raise greenhouse gasses and global warming.
Based Carnegie Mellon University’s Economic Input-Output Life Cycle Assessment, plastic bottle production generates a higher economic impact than glass or aluminum production and fewer greenhouse gases.[i]
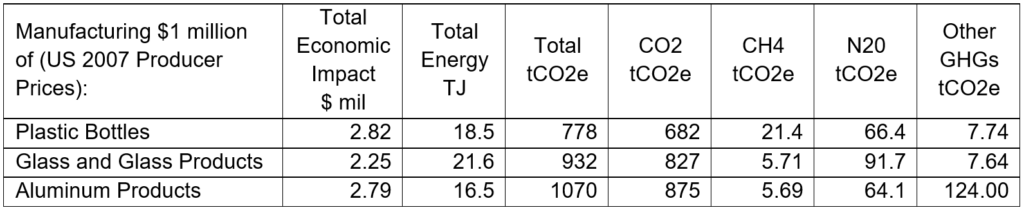
Let’s compare producing $1 million worth of each material, measuring purchases across the entire supply chain needed to produce that level of output. As shown in the table below, plastic bottle manufacturing generates the biggest total economic impact compared to aluminum and glass.[ii] Manufacturing $1 million worth of plastic bottles generates $2.82 million in economic impact. Respectively, glass and aluminum generate a $2.25 and $2.79 million impact.
Plastic bottle manufacturing uses less energy than glass manufacturing but more than aluminum manufacturing. However, it generates the least carbon dioxide (CO2) emissions, measured in metric tons. Accounting for every step of the supply chain, plastic bottle manufacturing generates 778 total tons of carbon dioxide equivalent, significantly less than the 932 tCO2e from glass manufacturing and 1,070 tCO2e from aluminum manufacturing.
For every dollar spent on plastic bottle manufacturing, $2.82 is added into the economy. This positive economic impact produces the lowest environmental impact compared to glass and aluminum.
Despite the differences among plastics, glass, and aluminum, however, consumers derive benefit from products made from all three of them. Otherwise, demand would be zero. We live in a multi-material economy, and freedom to choose expands possibilities for innovation that could solve climate change. A We can hardly imagine materials of the future. As Albert Einstein said, “No problem can be solved from the same level of consciousness that created it.”
[i] Carnegie Mellon University Green Design Institute. (2008) Economic Input-Output Life Cycle Assessment (EIO-LCA), US 1997 Industry Benchmark model [Internet], Available from:<http://www.eiolca.net> Accessed March 23, 2021. The U.S. 2007 Benchmark producer price is from the U.S. Environmental Protection Agency Environmentally Extended Input-Output (EPA USEEIO) Model. The EPA has not yet released a 2012 USEEIO Model.
[ii] Total (tCO2e) = global warming potential (GWP) is a weighting of greenhouse gas emissions into the air from the production of each sector weighting factors are 100-year GWP values from the IPCC 4th assessment report IPCC 2000, t CO2e = metric tons of CO2 equivalent emissions
CO2 (tCO2e) = emissions of carbon dioxide into the air from each sector. t CO2e = metric tons of CO2 equivalent emissions
CH4 (tCO2e) = emissions of methane into air from each sector. t CO2e = metric tons of CO2 equivalent emissions
N2O (tCO2e) = emissions of nitrous oxide into air from each sector. t CO2e = metric tons of CO2 equivalent emissions
Other GHGs (tCO2e) = emissions of other GHGs such as hydrofluorocarbons, perfluorocarbons, and sulfur hexafluoride into the air from each sector (100-year GWP values vary). t CO2e = metric tons of CO2 equivalent.
Total Energy TJ = total resource use from fuels and energy type sources from all sectors. TJ = to Terra Joules (10^2 Joules).