
Perc Pineda, PhD
Chief Economist, Plastics Industry Association
Trade and tariff policy took center stage in 2025 as the Trump Administration increased tariff rates on U.S. trading partners, including countries with which the United States maintains free trade agreements (FTAs). The policy continues to evolve. While the IEEPA tariffs, commonly referred to as reciprocal tariffs, have been rescinded, Section 232 tariffs on steel and aluminum remain in force, with changes to the list of imported derivative articles subject to the tariffs. Section 301 tariffs on imports from China also remain in place. More recently, the United States imposed additional Section 301 tariffs ranging from 10% to 12.5% on imports from 60 countries—including some with which it maintains FTAs—based on their failure to prohibit imports of goods produced with forced labor. The duties took effect on July 25, 2026. While the full implications of these tariff changes are still emerging, their potential effects on U.S. plastics trade can be gleaned from the forthcoming PLASTICS annual Global Trends report.
This year, following its first six-year review on July 1, 2026, the United States-Mexico-Canada Agreement (USMCA) entered an annual review process as the three countries negotiate the trade pact’s future. There is a high expectation that the agreement will be renewed, given that all three countries have long relied on trade in capital, intermediate, and finished goods among the partners as an integral part of their manufacturing supply chains and broader economies.
The prominence of Mexico and Canada in U.S. plastics trade
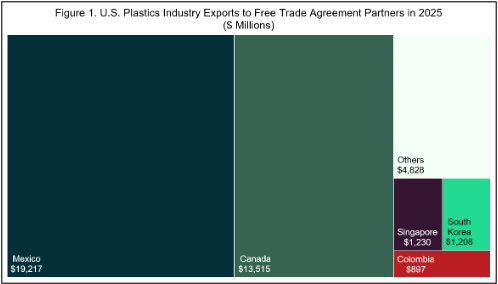
Mexico and Canada are the two largest trade partners of the U.S. plastics industry. Last year, preliminary trade data shows that the U.S. exported $19.2 billion of plastics (resin, products, machinery, and molds) to Mexico and $13.5 billion to Canada, as shown in Figure 1. Over the same period, the U.S. imported $13.6 billion from Canada and $8.4 billion from Mexico as shown in Figure 2. All told, the U.S had a $10.8 billion plastics trade surplus with Mexico while it had a $118.0 million trade deficit with Canada.
Plastics trade under free trade agreements (FTAs)
Last year, U.S. plastics exports to the 20 FTA countries totaled $40.9 billion, while imports totaled $29.0 billion, generating a trade surplus of $11.9 billion. Beyond Mexico and Canada, three other countries stood out as the largest exports of the U.S. plastics industry. As shown in Figure 1, Singapore, South Korea, and Colombia – in addition to the Mexico and Canada – make up the 5 largest export markets of the United States that are covered by an FTA. It has a trade surplus with Singapore ($736.5 million) and Colombia ($622.8 million), but a trade deficit with South Korea ($3.1 billion).
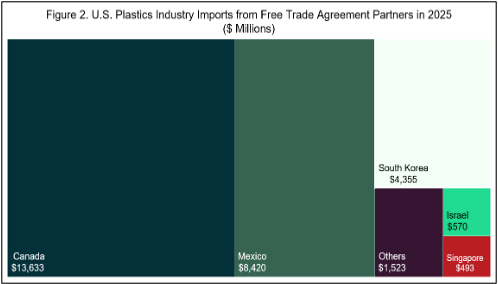
In terms of imports, outside of Mexico and Canada, the largest sources of plastics imports among the 20 FTA countries in 2025 are Korea, Israel, and Singapore, as Shown in Figure 2. The $4.4 billion of imports from South Korea explains the large trade deficit of the U.S. with the country. The U.S. imported $570 million of plastics from Israel – resulting in an $86.5 million trade deficit. Imports from Singapore totaled $493 million last year.
FTA country in focus
With the USMCA under review, Colombia is one of several markets that could warrant attention as manufacturers assess alternative markets and supply-chain links. According to Acoplásticos—the plastics association of Colombia—Colombia has a significant domestic resin-producing base, with installed capacity of approximately 1.375 million tons per year from 2023 to 2025, primarily polypropylene and PVC. However, the industry also relies heavily on imported resins, which account for approximately 93% of plastics processed in the country.
Domestic resin consumption reached approximately 1.6 million tons in 2025, up from 1.4 million tons in 2023. Polyethylene, polypropylene, PVC, PET, and polystyrene accounted for about 91% of total consumption.
Trade in finished and semi-finished plastic products is also significant. Imports increased from $1.3 billion in 2023 to $1.6 billion in 2025, with China accounting for approximately 44% of import value during 2023–2025. Exports totaled $834 million in 2025, with the United States the largest market at 25%, followed by Mexico (12%), Ecuador (12%), Venezuela (6%), Chile (6%), and Peru (6%).
Colombia therefore has a sizable domestic plastics market and established resin production, conversion, and export capabilities. At the same time, the industry remains dependent on imported resins, machinery, and other inputs and faces competition from Asian suppliers, particularly China.
Overall, changes in U.S. tariff policy and the ongoing USMCA review are likely to keep trade and supply-chain decisions in focus for the plastics industry. While Mexico and Canada remain central to U.S. plastics trade, other FTA partners such as Colombia, South Korea, and Singapore provide additional markets and sources of supply. The extent to which these trade relationships evolve will depend on tariff policy, the outcome of the USMCA review, and manufacturers’ efforts to manage costs, sourcing, and supply-chain risks.
2026 Plastics Global Trends Report
This year’s Global Trends report, PLASTICS’ annual flagship publication, provides comprehensive coverage and analysis of U.S. plastics trade, including plastics trade contained in other products, the PLASTICS Global Plastics Ranking®, and the overall trade outlook. The report will be released in Mexico City at PLASTIMAGEN, November 10–13, 2026.

Global trade prospects are significantly influenced by the global economic outlook. The state of the…
