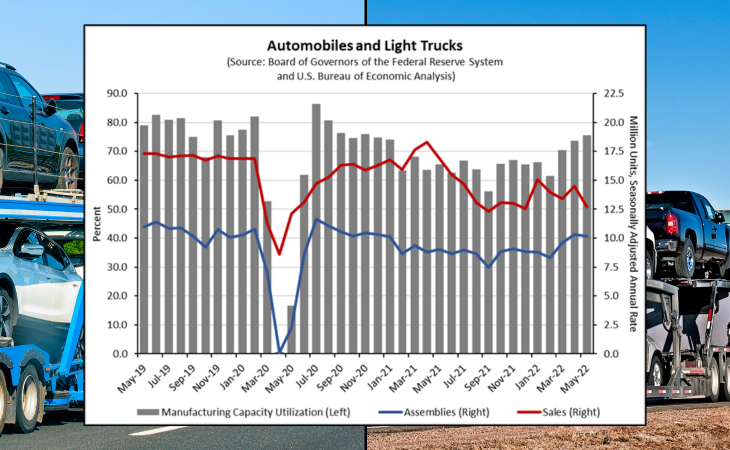
There have been signs of improvement in the recent months of 2022, as the capacity utilization rate in U.S. automobiles and light trucks manufacturing increased to 75.7% in May, the third consecutive month of increase. However, the increase was still below the 76.2% monthly average capacity utilization rate at the same time in 2019.
By Perc Pineda, Ph.D.
Chief Economist, Plastics Industry Association
As the economy locked down in 2020, the capacity utilization rate—percentage of potential output that is actually being realized—in automobiles and light trucks manufacturing plummeted from 82.0% in February 2020, the start of the COVID-19 recession, to 0.7% in April 2020, the end of the recession.
While the capacity utilization rate rose to 86.4% in July 2020, a higher capacity utilization rate was unsustainable due to automotive part supply chain bottlenecks. By September 2021, capacity utilization rates in automobiles and light trucks manufacturing was 52.6%. Thereafter the utilization rates varied monthly as materials shortages continued to challenge manufacturers.
There have been signs of improvement in the recent months of 2022, as the capacity utilization rate in U.S. automobiles and light trucks manufacturing increased to 75.7% in May, the third consecutive month of increase. However, the increase was still below the 76.2% monthly average capacity utilization rate at the same time in 2019.
Assemblies are in the equation
Assemblies for automobiles and light trucks also increased in March and April of 2022 to 9.6 million and 10.3 million units, respectively. While they decreased marginally to 10.2 million in May, assemblies above 10.0 million are a significant improvement from the COVID-19 recession. For example, in April 2020, assemblies fell to 0.1 million from 10.8 million in February of that year. And although assemblies rose to 11.7 million in July 2020, they continued to decrease monthly as supply chain challenges lingered. By September 2021, assemblies decreased to 7.5 million units, but have gradually increased since as shown in the accompanying graphic.
Parts manufacturing chain-link effect
The U.S. automobile and light truck manufacturing sector relies on imported automotive parts. Last year, the U.S. imported an estimated $159.6 billion of automotive parts. More than half (57.3%) of U.S. automotive parts imports came from its free-trade partners—Mexico (37.6%) and Canada (10.3%)—as well as China (9.4%). A slowdown in the production of automotive parts in these countries will impact U.S. manufacturing. As the global economy dealt with the residual effects of the pandemic, the recent lockdown in China this year slowed supply chain recovery.
The larger picture
While recent data points toward improving automobiles and light trucks manufacturing in the U.S., inventory continues to fall short of demand. This has caused upward price pressures and weaker sales. In May, the Consumer Price Index for new vehicles was 12.6% higher than a year earlier. Automobile and light truck sales rose from 8.6 million units in April 2020 to 18.3 million units a year after on a seasonally adjusted annual rate. However, sales have been downward trending since. In May, sales were down to 12.5 million units.
As the Federal Reserve tightens financial conditions to address persistent inflation, higher interest rates will cause a higher unemployment rate. The Federal Reserve raised the fed funds rate to a 1.50% – 1.75% target range in June. The fed funds midpoint target range is projected to reach 3.4% this year. As the Fed continues to raise the benchmark lending rate, auto loan rates will likely also increase. Higher unemployment and interest rates, along with gasoline prices at historic highs, will negatively impact automobile and light truck demand for the remainder of 2022 and 2023.